What you will find on this page
- Overview and main uses of system and custom reports
- Creation procedure and the meaning of each filter item
- Definition of indicators and how to view the results screen
- Stumbling Points and How to Deal with Them
Prerequisite.
- Custom reports are a beta feature and may take several minutes to return results. Please contact support if you find any anomalies.
What you can do (overview)
- Results can be aggregated by time period, product, scenario (Automate Action), campaign, email/line message, customer segment, etc.
- The output is focused on only the necessary indicators, and settings can be duplicated and reused from the results screen.
Use of system reports and custom reports
- Systems Report: When you want to get a full view immediately. Settings cannot be changed/deleted/immediately displayed.
- Custom Reports: When you want to dig deeper by product, scenario, segment, etc. You can freely narrow down, select indicators, and duplicate.
What is a System Report?
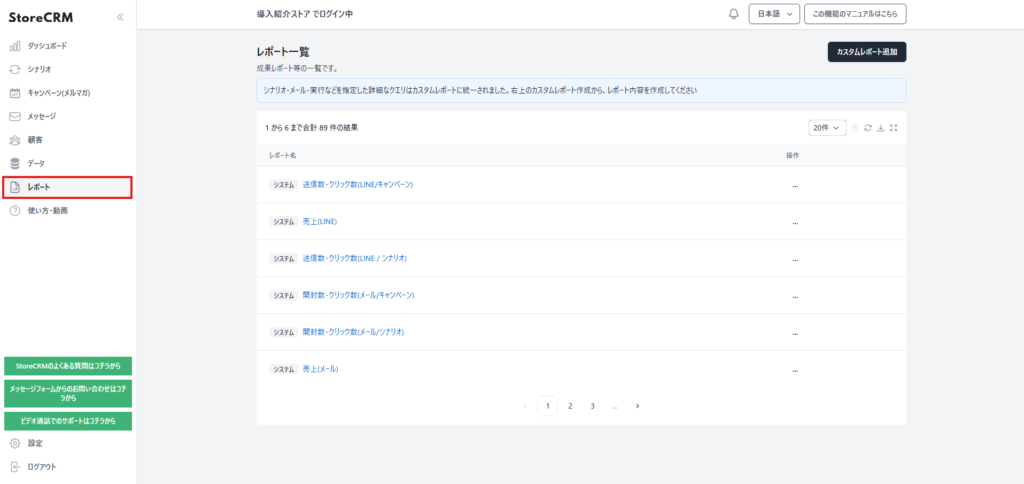
- This is a canned report provided in the initial StoreCRM state (indicated by the "System" badge in the list).
- Cannot be deleted or duplicated (the duplicate button is not displayed). It is displayed immediately without waiting for generation.
- Data reports can be checked for major categories such as scenarios, campaigns, emails, and lines.
Number of transmissions and clicks (LINE/Campaign)
Sales (LINE)
Number of transmissions and clicks (LINE / Scenario)
Number of opens and clicks (emails/campaigns)
Number of opens and clicks (emails/scenario)
Sales (e-mail)
Typical uses
- I want to see a quick look at daily sending, opening, and clicking trends.
- I want to immediately see basic indicators by delivery channel.
- I want to get an approximate trend before creating a custom report.
| mail (usu. in phrases like "e-mail", "text message", etc.) |
|
| LINE Messages |
|
Accessing System Reports
1. click on StoreCRM -> [Reports].
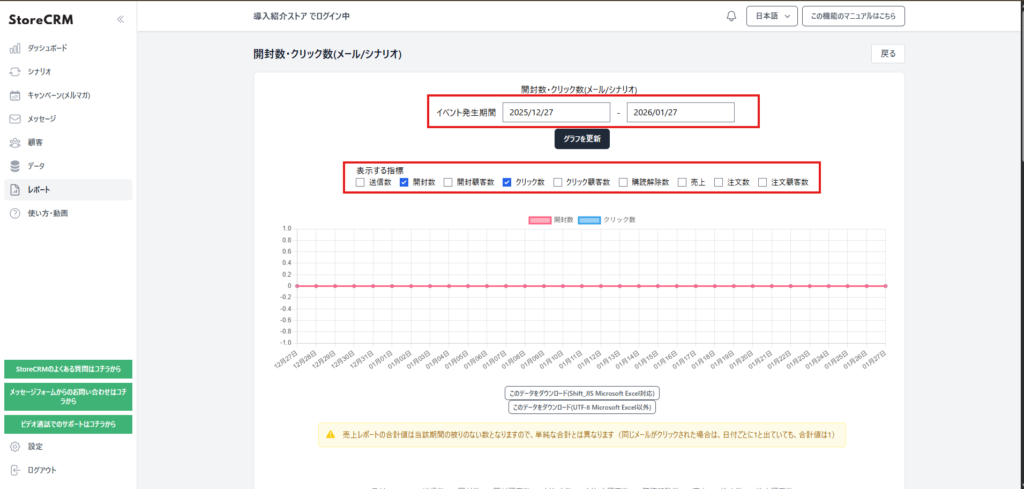
Select the report you wish to review. The report detail screen will appear. Specify the time period and display items, and click "Refresh Graph" to display the data.
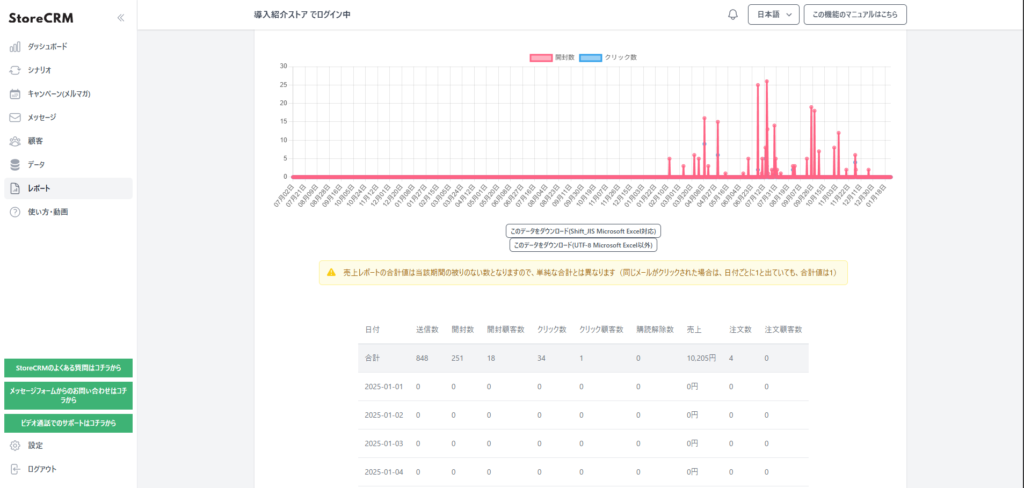
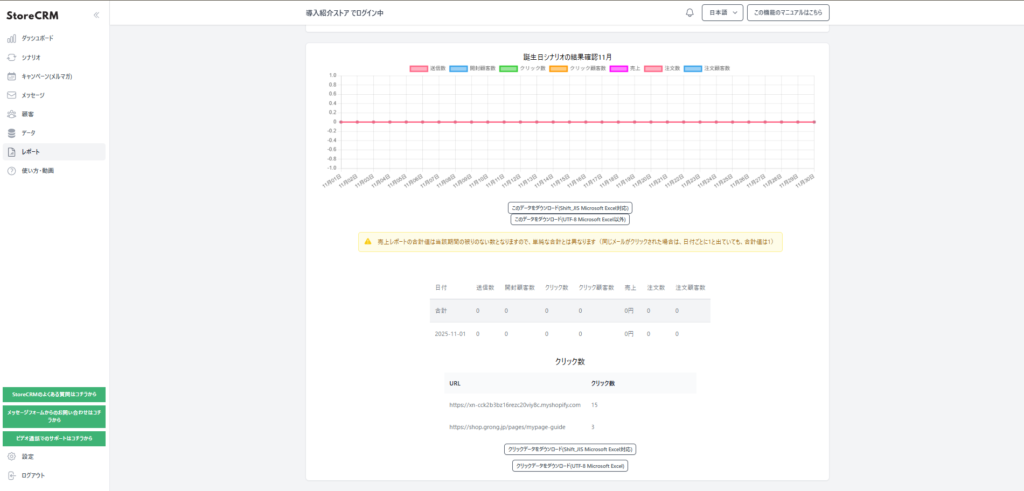
3. A line graph is displayed at the top, and a table and the number of clicks on each link are displayed at the bottom. Data can also be exported in csv format from [Download this data].
What is a Custom Report?
- This is a flexible reporting function that allows you to freely combine and aggregate distribution channels, products, scenarios (Automate Action), campaigns, customer segments, etc.
- You can select and output only the indicators you need (number of transmissions, opens, clicks, sales, orders, etc.).
- The settings you create can be reused from the "Duplicate" menu, and are also suitable for comparisons by changing only the period of time.
- Aggregation is performed asynchronously, and a graph is displayed on the detail screen when completed (since this is a beta offering, it may take several minutes for results to appear).
- It is suitable for in-depth analysis and verification of the effectiveness of specific measures. It is recommended to use the system report for a general overview and the custom report for detailed analysis.
Steps to create a custom report
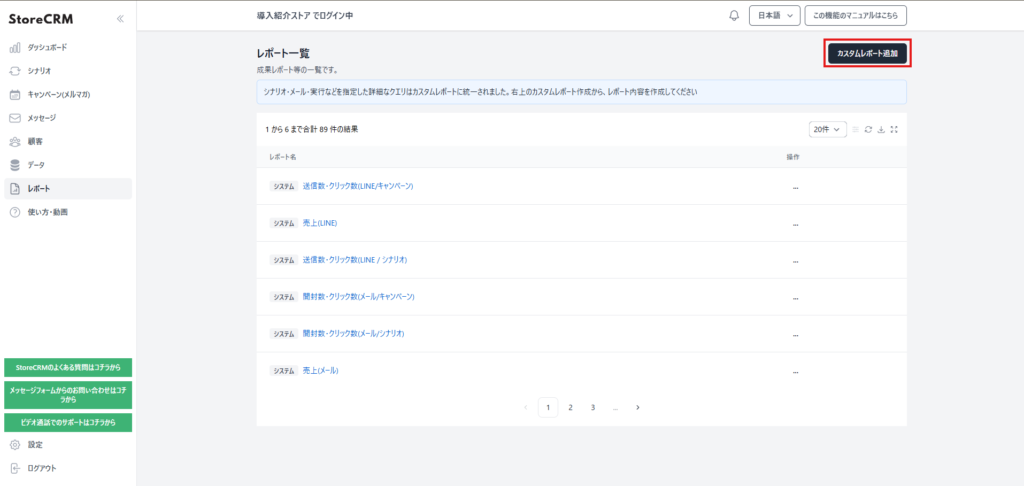
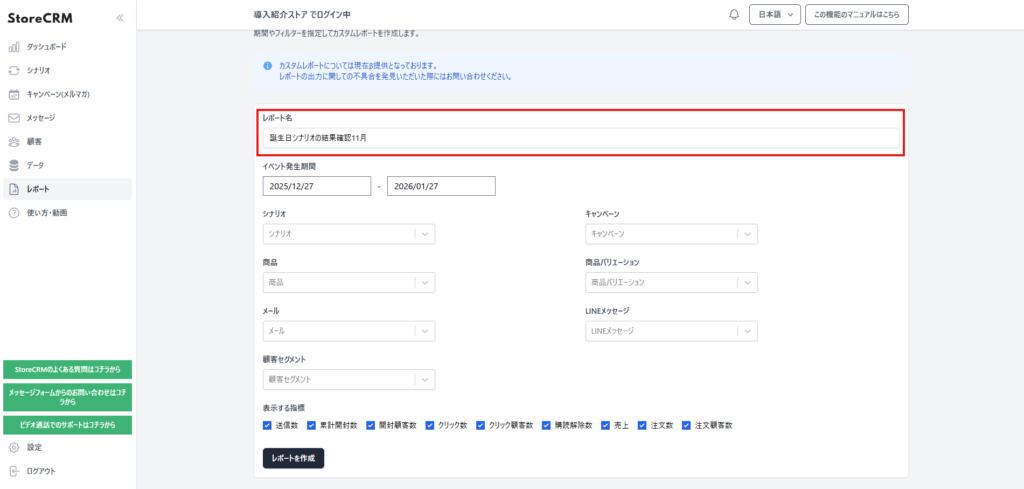
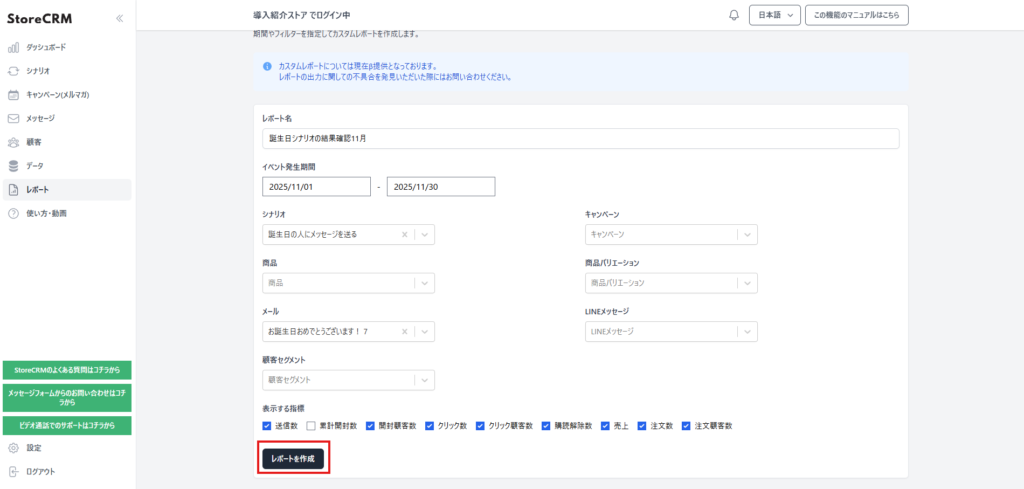
1. Click on "Report List" -> "Add Custom Report".
2. Enter a "Report Name".
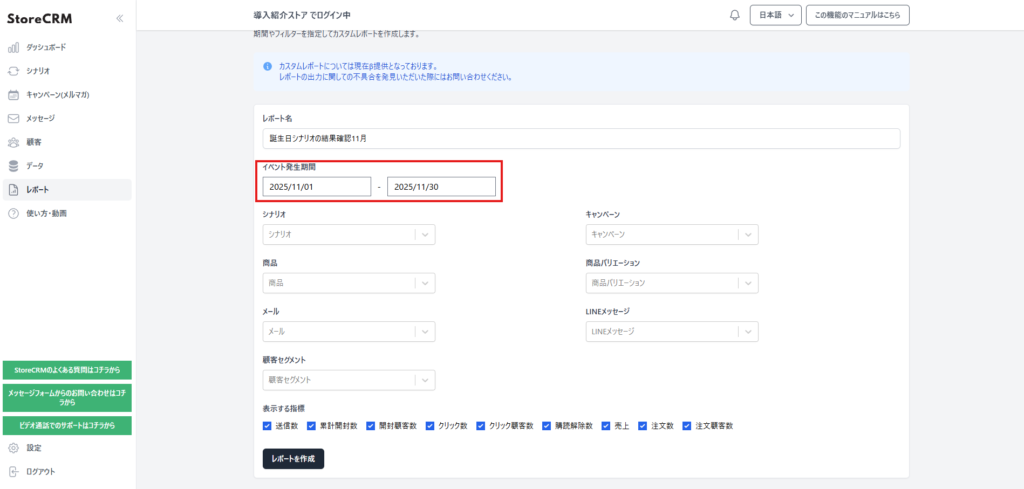
3. Select the date range you wish to aggregate in the "Event Occurrence Period.
4. Set the following filters as neededThe following is a list of the most common problems with the
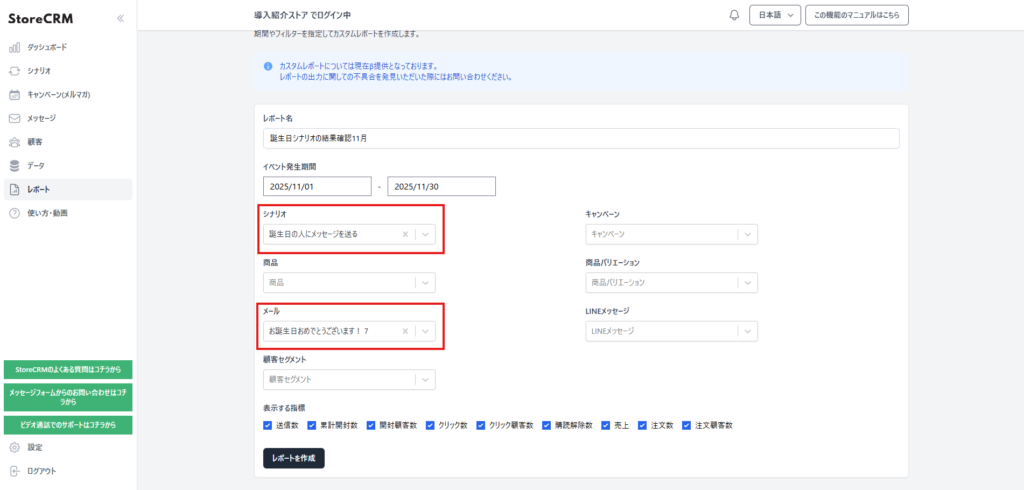
- Scenario: Filter by Automate Action. Use to check the results of each scenario.
- Campaigns: Aggregated by distribution campaign.
- Product / Product Variation: Use this option when you want to check the response to an individual product or a specific variation. Multiple selections are allowed.
- Email / Line Messages: Used to compare results by content.
- Customer Segment: Used when you want to verify the results of segment delivery.
- Customer ID / Email: Used to track specific customer behavior.
- Event Occurrence Period: Filter by event date, such as sent, opened, clicked, etc.
5. Check the necessary indicators in "Indicators to be displayed" (all selected by default).
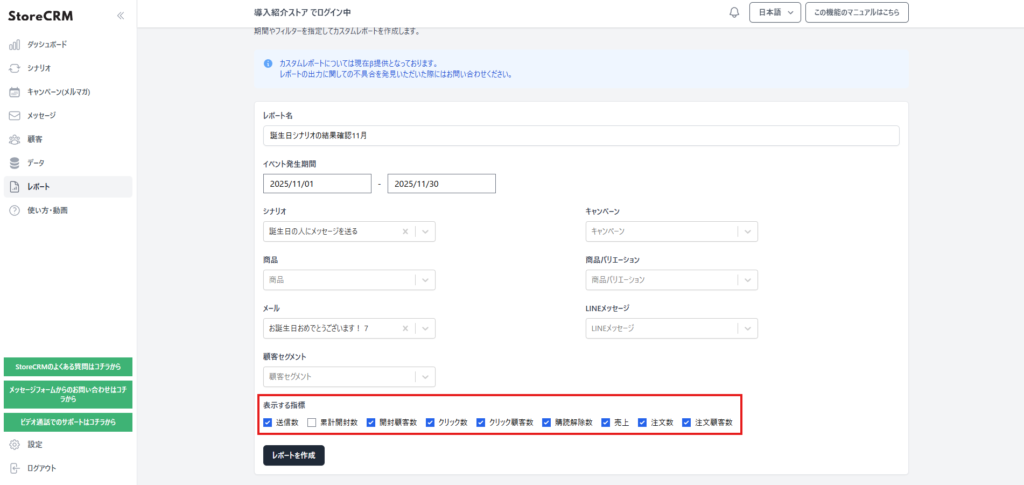
6. Press "Generate Report" to move to the detail screen. Once generated, a graph will be displayed.
Definition of Indicators
- Sent: Total number of target messages sent
- Cumulative openings: Total number of open events
- Opened Customers: Number of unique customers who have opened the door.
- Clicks: Total number of click events
- Number of customers who clicked: Number of unique customers who clicked
- Unsubscribes: Number of unsubscribes that resulted in unsubscription
- Sales: Amount of sales tied to the period
- Orders: Number of orders tied to the
- Customers Ordered: Number of unique customers who placed an order
Common stumbling blocks and solutions
- Please enter a report name" is displayed: The report name is blank.
- Generation does not finish: Check to see if the time period or refinement is not too broad, and reduce unnecessary indicators to speed up the process.
- Sales or orders are zero: the filter may be too strict or out of period. Loosen the conditions and recreate the filter.
Related Pages